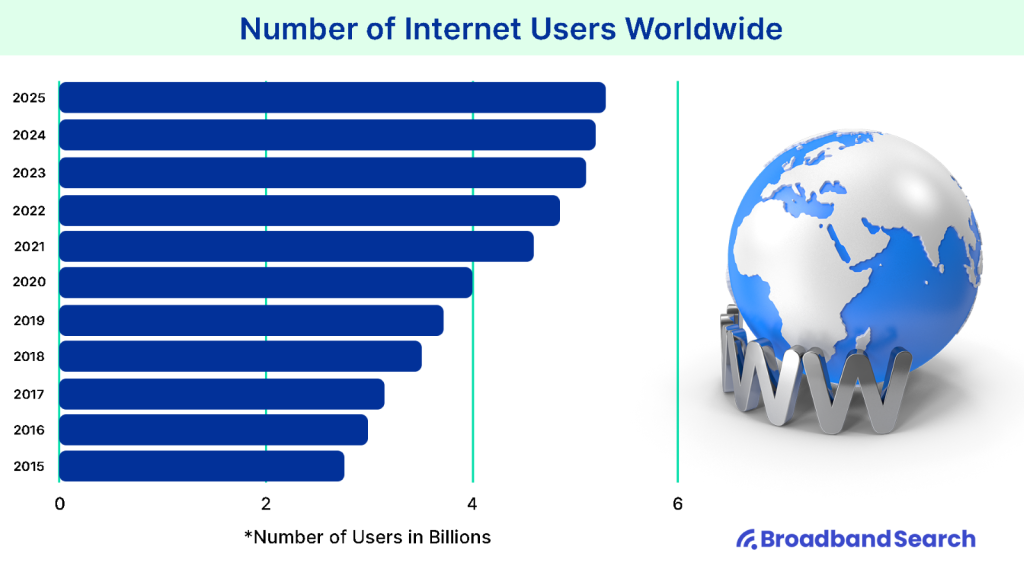
The internet is ingrained in our lives, from how we work and shop to how we stream, scroll, connect, and interact. And the numbers are staggering when put into perspective: Over 6 billion people use the internet, and over 5 billion active social media identities. The world’s population as of December 2025 is 8.2 billion.
This guide covers the most important 2025 internet stats on global use, mobile and desktop behavior, social media, ecommerce and payments, streaming video, and the rapid growth of connected devices. We distill these complex metrics down to digestible figures, all of which illustrate humankind’s internet interconnectedness.
Key Internet Statistics For 2025 (At A Glance)
- About 6.0 billion people use the internet in 2025, roughly three-quarters of the global population.
- About 2.2 billion people remain offline worldwide.
- Active social media user identities total about 5.2 billion in 2025 (note: identities are not always unique people).
- Global web traffic is about 52% mobile, 47% desktop, and 1% tablet (latest monthly snapshot). StatCounter Global Stats
- Roughly 5.8 billion people use a mobile phone, and smartphones make up the vast majority of handsets. DataReportal – Global Digital Insights
- There are about 21.1 billion connected IoT devices in 2025, with forecasts reaching 39 billion by 2030.
- 5G covers about 55% of the world’s population, and 5G subscriptions are in the billions.
- The average person spends about 6 hours and 38 minutes online per day (connected adults).
- Global retail ecommerce sales are projected at about $6.4 trillion in 2025, up about 6.8% year over year.
How Many People Use the Internet In 2025?
About 6.0 billion people use the internet in 2025, which is roughly 75% of the world’s population. That’s a huge milestone, but the contrast to that number is almost as surprising: about 2.2 billion don't use the internet. Sure, that number includes those who are unable to use the internet (looking at you, newborns), but other reasons include access is too expensive, unavailable, or not safe or useful enough to prioritize.
Internet Use by Age and Gender
Young people are still the most connected group globally. In 2025, about 82% of people ages 15–24 use the internet, compared with about 72% for everyone else. When you think about it, people in this age range don’t know the world without the internet. And of global internet users in 2025, about 77% are men, 71% are women.
How Has Mobile Internet Changed the Way We Go Online?
Mobile internet has made access constant, personal, and location independent, to the point that most people access it via their smartphone than they do from their computer.
Smartphone Adoption and Mobile Access
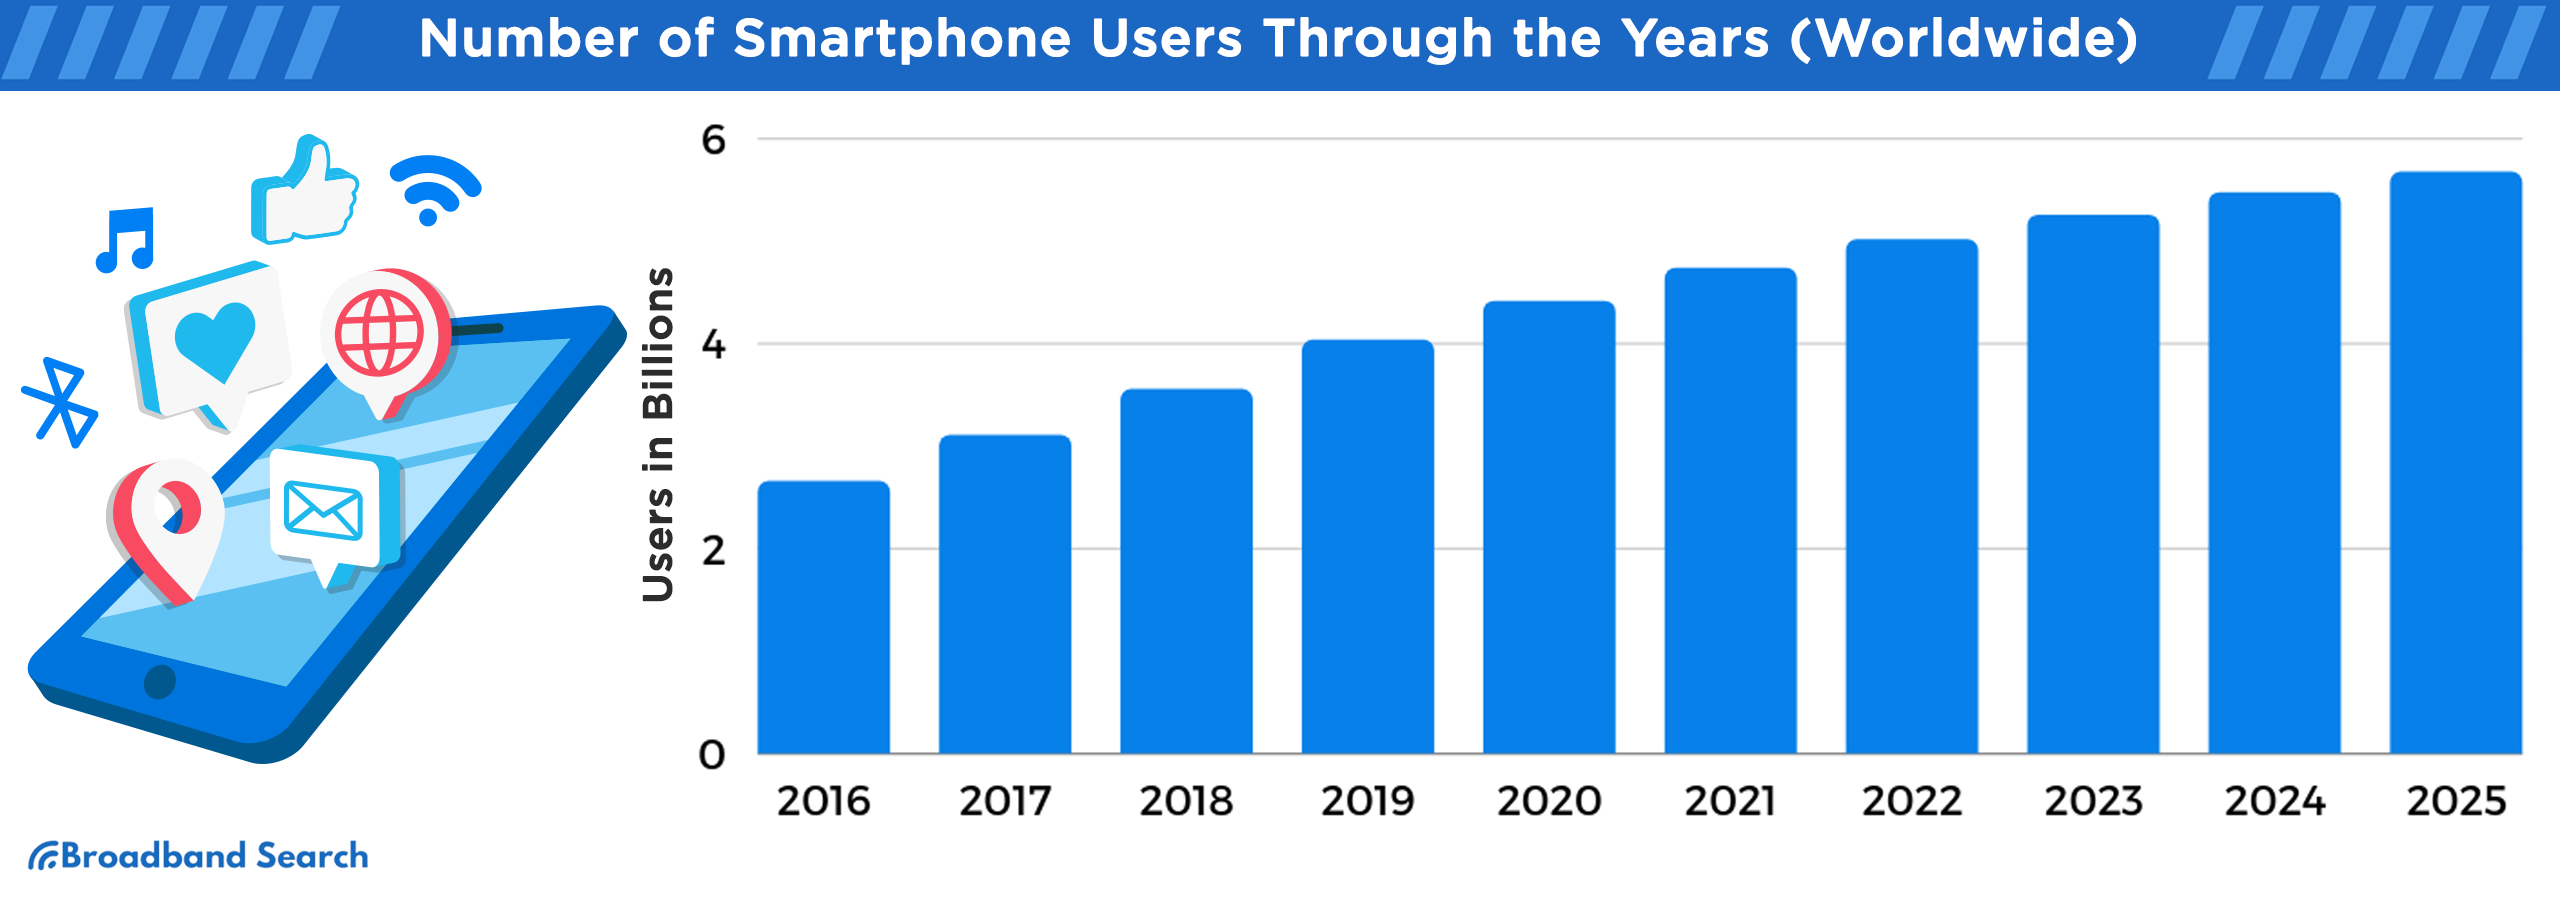
Around 5.78 billion people use a mobile phone today. That’s about 70% of the global population and the majority of mobile phones in use are smartphones. In the U.S., 9 in 10 adults own a smartphone, and its the first, and sometimes only, computing device people own.
Mobile Vs Desktop Internet Traffic
When was the last time you looked at Facebook from a laptop or desktop computer? While not specific to Facebook use, the behavior is indicative of how most people access the internet. Globally, mobile makes up 51.6% of web traffic, while desktop traffic is about 47.0% and tablets about 1.4%.
And then there’s time spent online: connected adults average 3h 46m via mobile versus 2h 52m via computers each day. This trend is so prevalent that websites are designed with mobile-first layouts in mind.
Mobile Broadband And 5G Coverage
Mobile networks are under increasing demand each year, and 5G is a big part of demand. In 2025, 55% of the world’s population has access to a 5G network, and 5G subscriptions have reached about 3 billion.
Still, rural gaps still exist, especially where towers are sparse or terrain makes connectivity challenging. That is one reason 5G home internet and fixed wireless options are getting attention: they can extend broadband-like connectivity faster than cable or fiber can. The expansion and adoption of 5G home internet will be an interesting space to watch in 2026.
What Kinds Of Internet Connections Do People Use?
People use a mix of fixed broadband (for stable home and work connections) and mobile broadband (for everywhere else), and the “best” option often depends on what’s available in a given area. Most households end up combining technologies, especially as streaming, remote work, and smart devices demand reliability.
Fixed Broadband: Fiber, Cable, and DSL
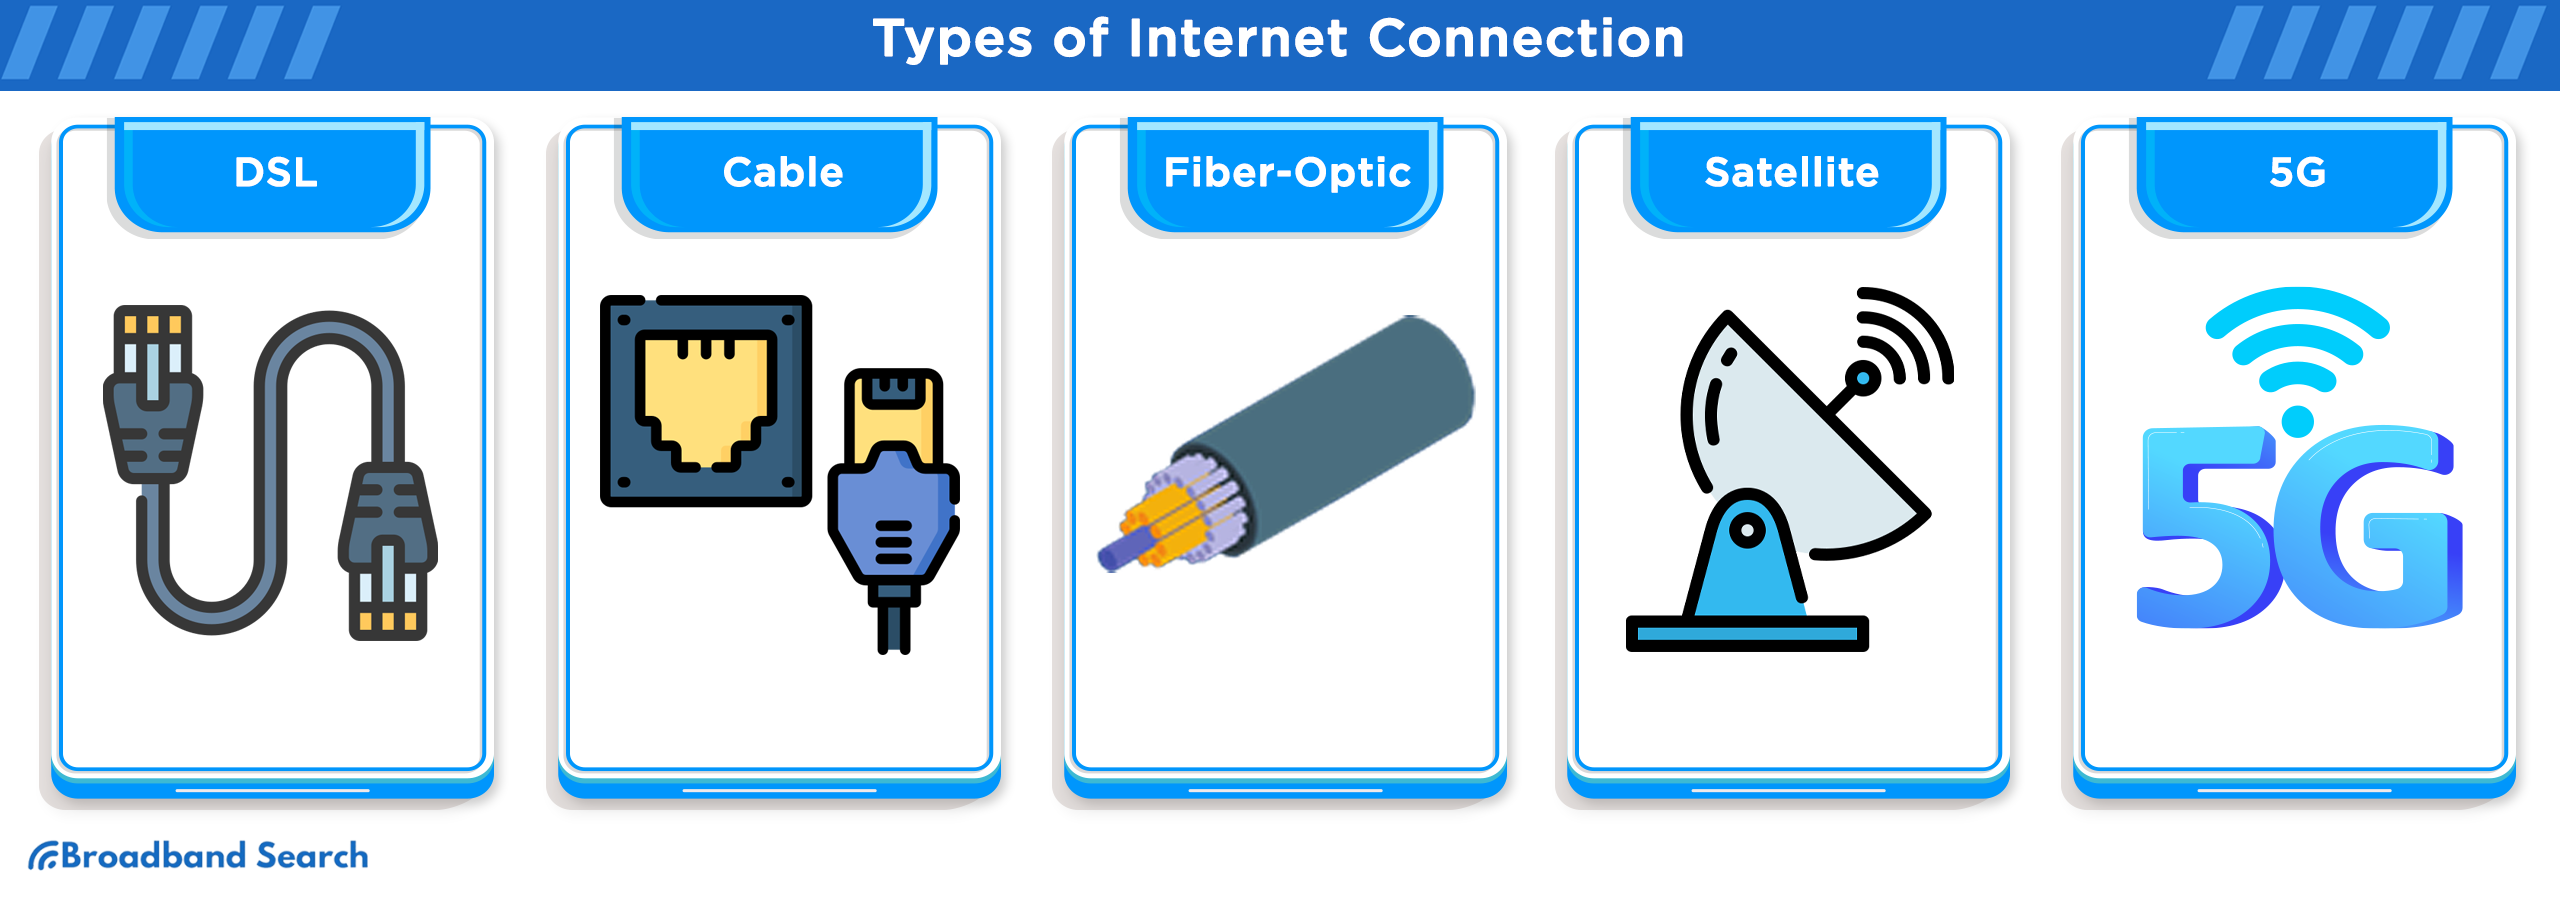
Most households access the internet via a fixed broadband, or wired, connection to the home. Copper-based services (cable and DSL) are the most prevalent, but fiber networks are being deployed in more areas.
- Fiber: Uses strands of glass to transmit data with light. Often the fastest and most consistent, with strong upload speeds.
- Cable: Uses coaxial cable networks. Widely available in many cities and suburbs, typically fast downloads, uploads vary.
- DSL: Runs over telephone lines. Availability can be broad, but speed depends heavily on distance from provider equipment.
Rural Vs Urban Internet Access
Rural areas, for the most part, are underserved in broadband access compared to urban areas. This is due mostly to lack of infrastructure, but also the cost of building infrastructure in sparsely populated areas. Lack of access is reflected in usage statistics to, as urban internet use is around 85% versus about 58% in rural areas in 2025.
That gap is why alternatives matter. In rural regions, satellite internet and fixed wireless are often the only access options and struggle to offer the speed and reliability of fiber or cable internet.
How 5G Is Changing Home and Mobile Internet
As we mentioned, this is the space to watch in 2026. 5G can improve internet experiences in three main ways: higher speeds, lower latency, and more capacity for crowded networks. In some markets, 5G has also accelerated home internet options via fixed wireless access, especially where wired infrastructure is slow or cost prohibitive.
Its future potential is real, but current limitations are too: coverage is still uneven, and the best performance often requires newer devices and strong signal conditions.
How Do Social Media and Online Communication Shape Internet Use?
Social media and messaging apps drive daily habits, attention, and communication, so a large share of internet use is now spent scrolling social feeds, chats, and short-form video platforms.
Social Media Usage Worldwide
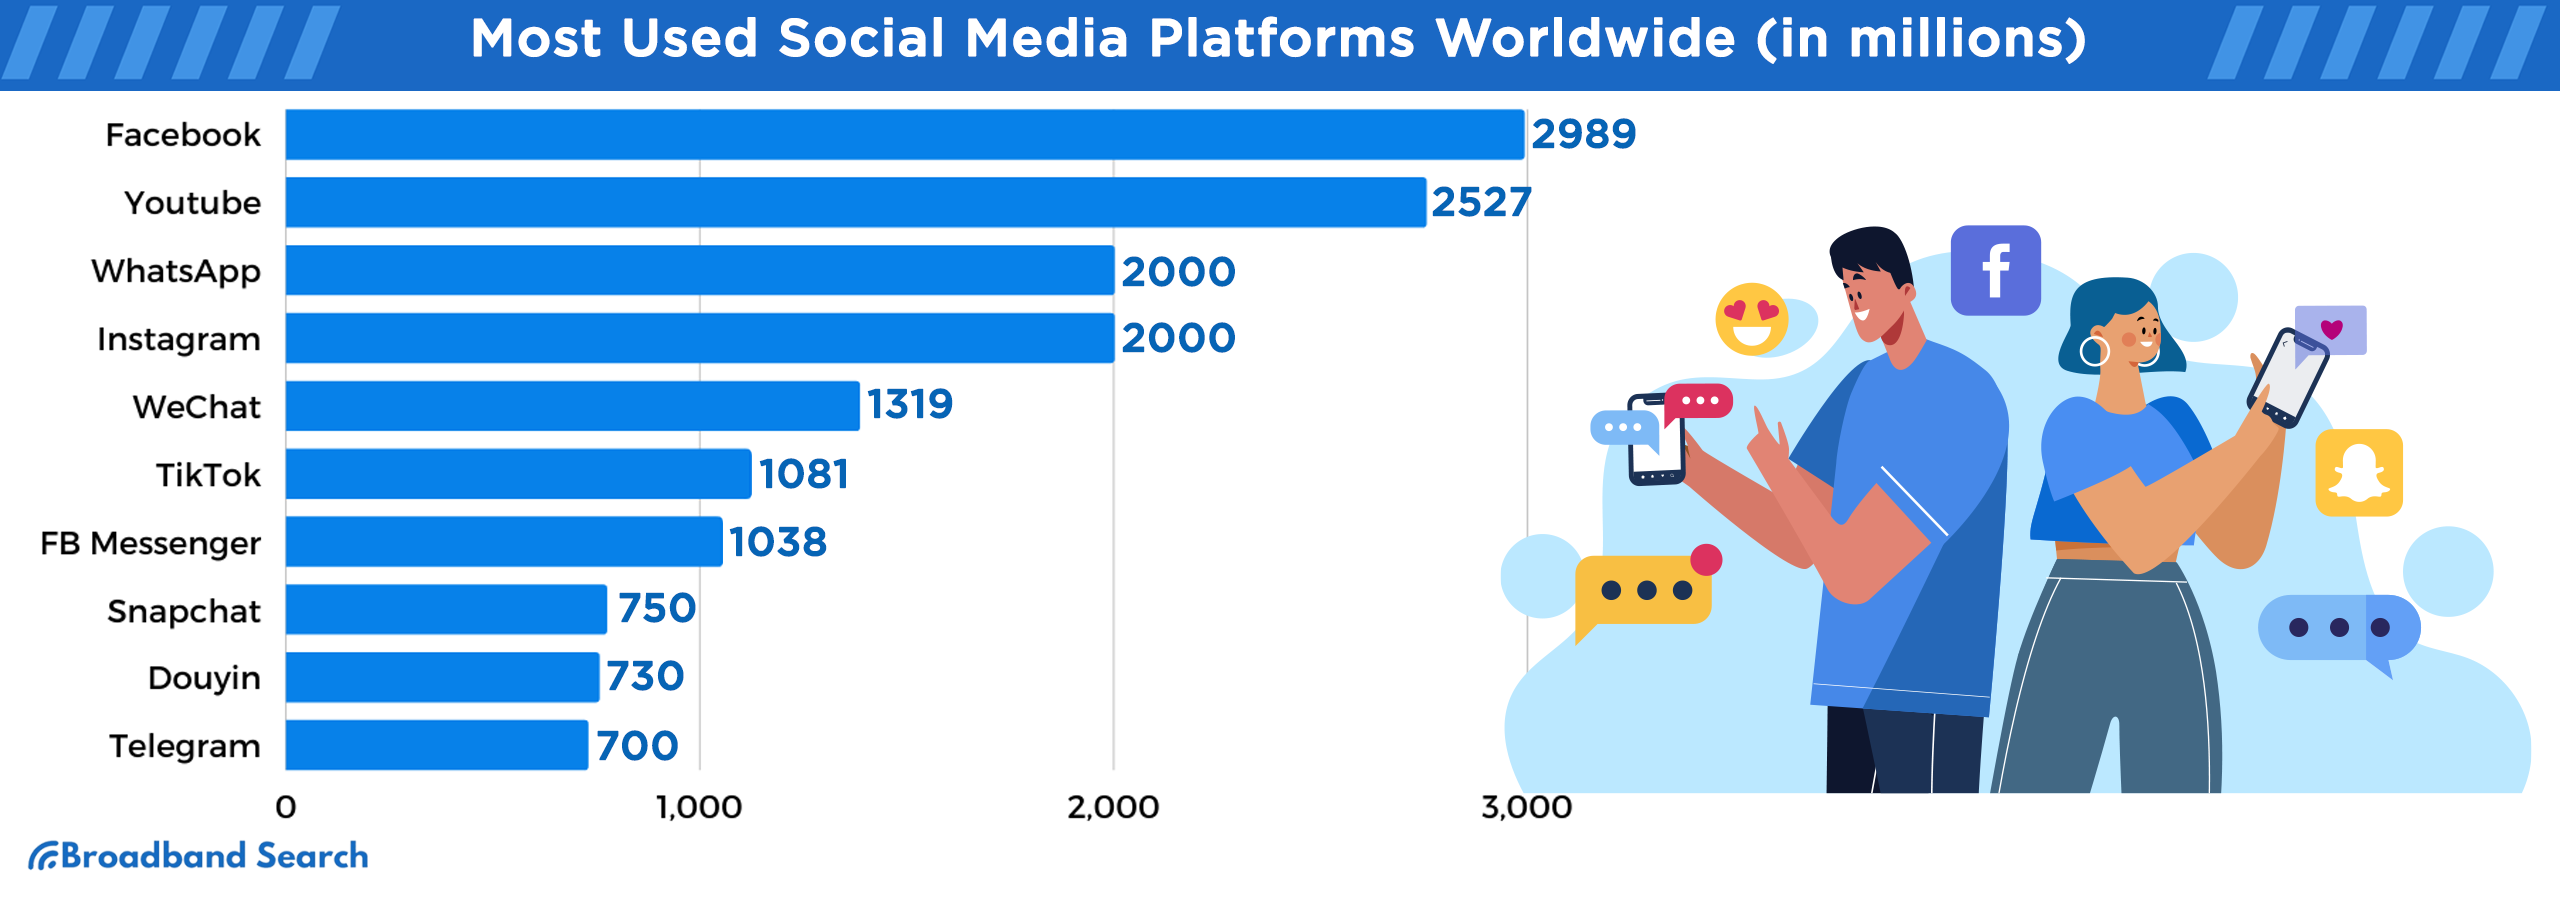
There are about 5.2 billion active social media user identities globally in 2025. No wonder social platforms have such a strong influence on news, entertainment, and shopping behavior.
A few of the largest platforms include:
- Facebook: 3.07 billion monthly active users
- WhatsApp: 3.0 billion monthly active users
- Instagram: 3.0 billion monthly active users
- YouTube: 2.58 billion potential advertising reach (often lower than total MAUs)
- Source: DataReportal
Messaging Apps, Email and Real-Time Chat
Messaging is the way many people communicate, especially through apps like WhatsApp, WeChat, Messenger, and Telegram. Several of these services now operate at a massive scale, with multiple platforms reporting user bases at or near a billion.
Email still shines for receipts, account security, formal work communication, and long-form updates. But for quick, social, back-and-forth conversations, chat’s the champ.
Businesses use messaging and chat every day for:
- Customer support and order updates
- Marketing and community building
- Team communication and group coordination
Video Calls, Remote Collaboration and the Future of Work
Video calls and real-time collaboration tools (Zoom, Teams, Meet, Slack-style chat) are now the norm for many workplaces. The practical impact is that internet expectations have risen for remote workers: people notice jitter, lag, and dropouts more quickly when their job depends on stable video meetings. And for that reason, people define reliable internet more by upload performance than the download speed providers advertise.
Online Shopping and Digital Payments Stats
Online shopping is enormous in 2025, and digital payment methods continue to grow in use and establish dominance over more traditional forms of payment.
Global Ecommerce Growth
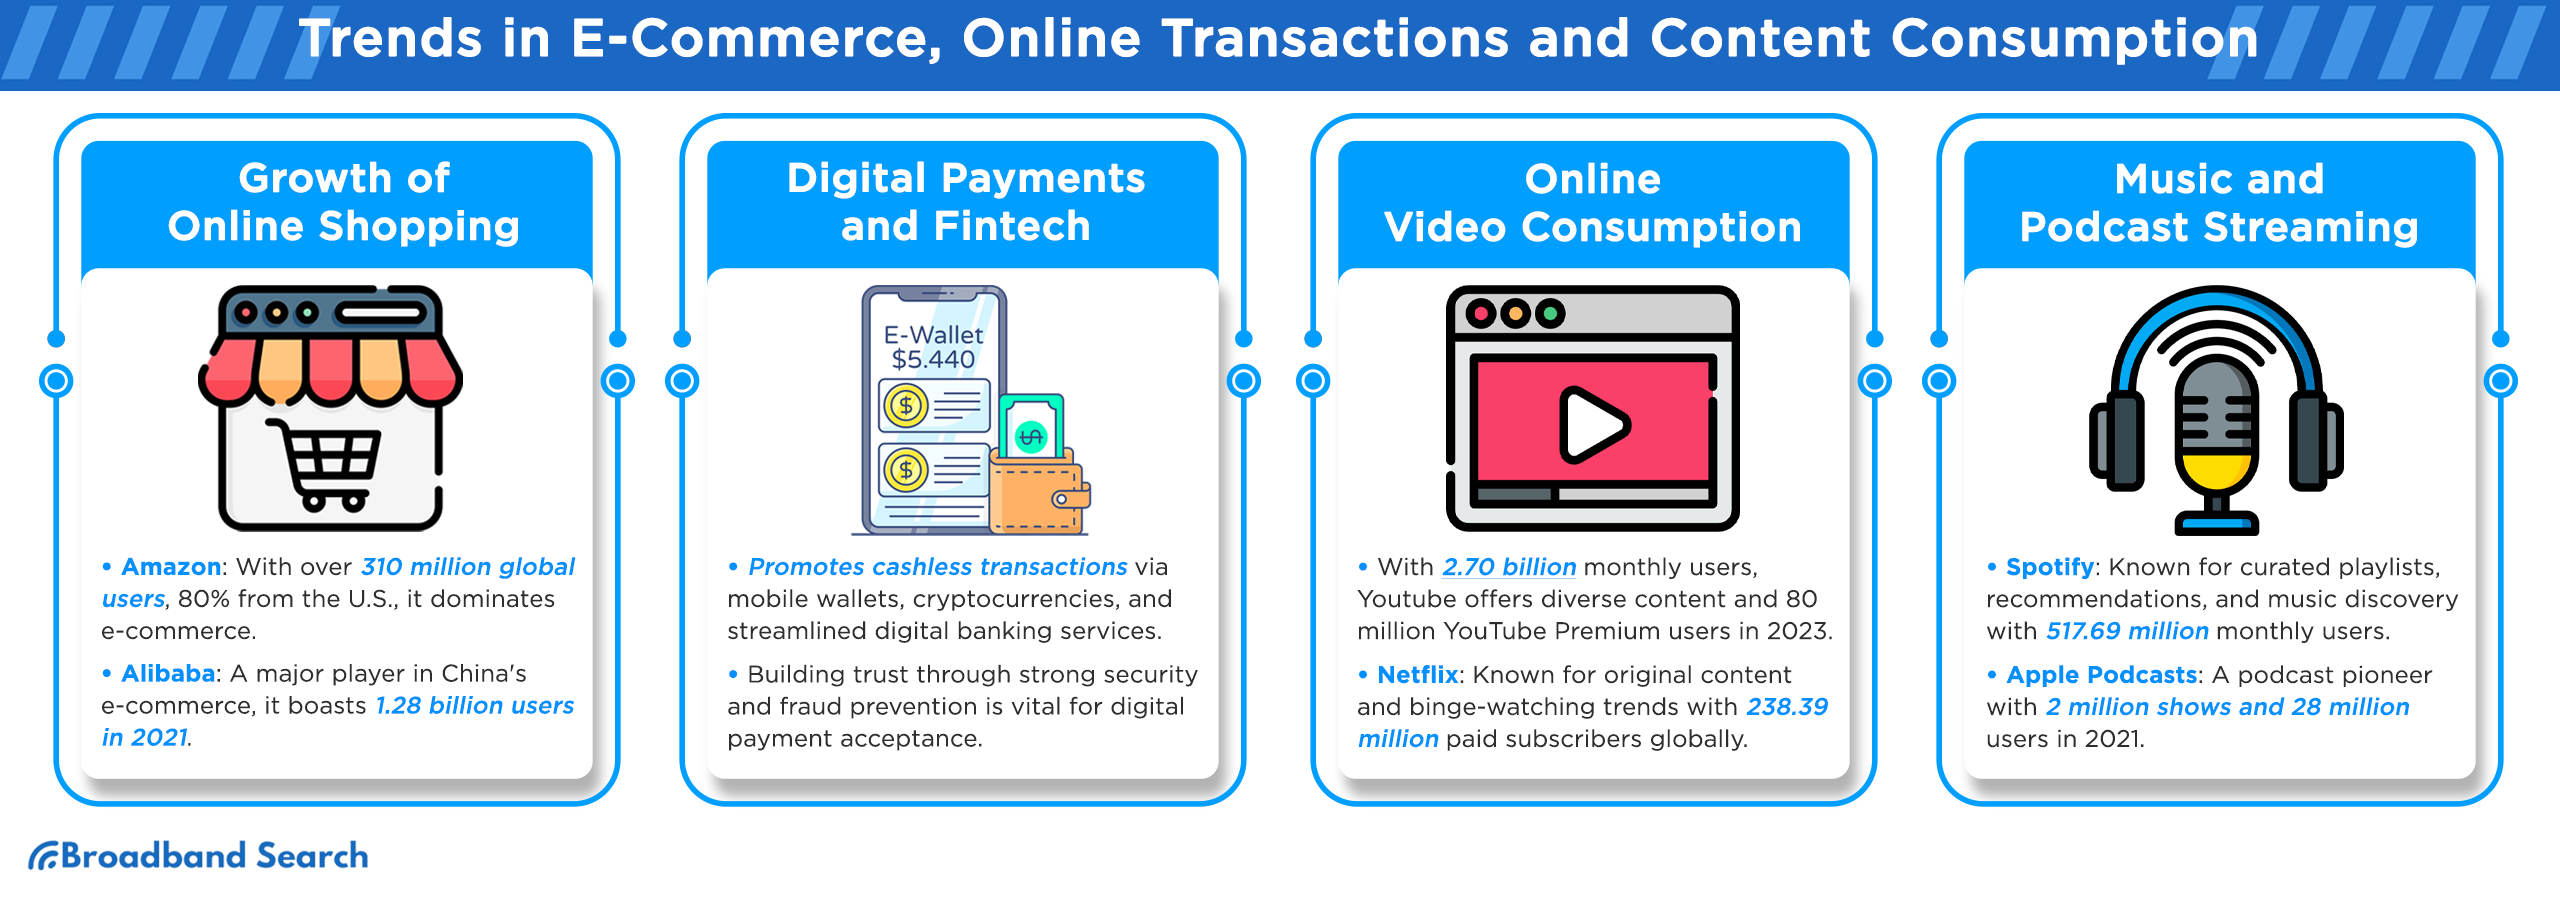
Retail ecommerce sales worldwide are expected to reach $6.419 trillion in 2025, growing about 6.8% year over year. Major markets include the U.S., China, and Europe, but cross-border shopping and mobile commerce continue to expand among many users and regions.
Two patterns continue to show up:
- More shopping happens on phones.
- More purchases happen across platforms, not just on a brand’s website.
Digital Wallets, Online Payments and Fintech
Most shoppers now shuffle a handful of payment options: credit and debit cards, PayPal, Apple Pay, Google Pay, bank transfers, and popular regional wallets. Buy now, pay later options and subscriptions are also more common than they were a few years ago.
Worldpay’s reporting highlights how fast “digital payments” have grown: from 34% of ecommerce value in 2014 to 66% in 2024, and from 3% to 38% of in-store value over the same period.
As these shopping and payment trends increase, so do security and fraud concerns. When shopping online and using digital payments,
- Turn on two-factor authentication for shopping and banking accounts.
- Use unique, strong passwords (a password manager helps).
- Pay only on secure, trusted sites and watch for lookalike URLs.
Changes in Streaming, Gaming and Online Entertainment
Online entertainment keeps growing in 2025, and streaming video and audio remain two of the biggest hogs of household bandwidth. We’re not just watching more, we’re watching in more places: phones, TVs, laptops, and even in the background while doing other things.
Video Streaming and Short-Form Video
YouTube remains one of the biggest video platforms on the planet, and Netflix continues to be a leader in paid streaming. Netflix reports over 300 million paid memberships globally. Short-form video is also a major force, with platforms like TikTok, Reels, and Shorts shaping what “watching” looks like today: fast, vertical, and highly personalized.
Music, Podcasts and Live Streaming
Spotify reports 713 million monthly active users and 281 million subscribers as of its 2025 third quarter earnings update.
Live streaming (especially for gaming, events, and creator content) pushes real-time video further into the mainstream. One more reason why upload speeds and latency matter more than they used to.
How Many Connected Devices Are Online? (IoT Statistics)
There are about 21.1 billion connected IoT devices online in 2025, and forecasts point to roughly 39 billion by 2030. That’s phones, laptops, thermostats, doorbells and all the other connected devices that can automate your home and capture your fancy.
Growth in IoT Devices and Future Projections
IoT stands for “internet of things,” which is a simple idea: everyday objects that collect data and connect to the internet so they can automate tasks, share status updates, or be controlled from the smartphone that 9 in 10 adults own. And there are over 20 billion of them, a number that may double by 2030.
Smart Homes, Healthcare and Industry
IoT devices have many uses and can be broken down into three categories:
- Smart homes: speakers, lights, thermostats, cameras, locks
- Healthcare: wearables, remote monitoring, connected medical devices
- Industry: sensors for manufacturing, logistics tracking, predictive maintenance
The biggest benefit to IoT devices is their efficiency. Connected sensors can help reduce wasted energy, prevent downtime, and improve safety. And turn your heat up without having to get out of your warm bed.
Data, Privacy and Security Risks
The more IoT devices there are in your house, the more access points there are, and the more data that is being collected. If you’ve packed your home with IoT devices, privacy and security hygiene is a must. Here are some quick tips to help you get started:
- Use strong, unique passwords for device accounts and Wi-Fi.
- Keep device firmware updated.
- If your router supports it, put smart devices on a separate guest network.
Internet Trends to Watch
What’s next for the internet is a faster, more personalized, more automated experience, but also one with bigger privacy, security, and regulation concerns. What makes life convenient also creates new risks and new rules. And AI plays a big role in this, for better or worse.
AI, Automation and Personalized Experiences
AI already powers recommendations, search features, fraud detection, translation, and customer service. Search is experiencing a major shift: Google reported AI Overviews has over 2 billion monthly users across many countries and languages.
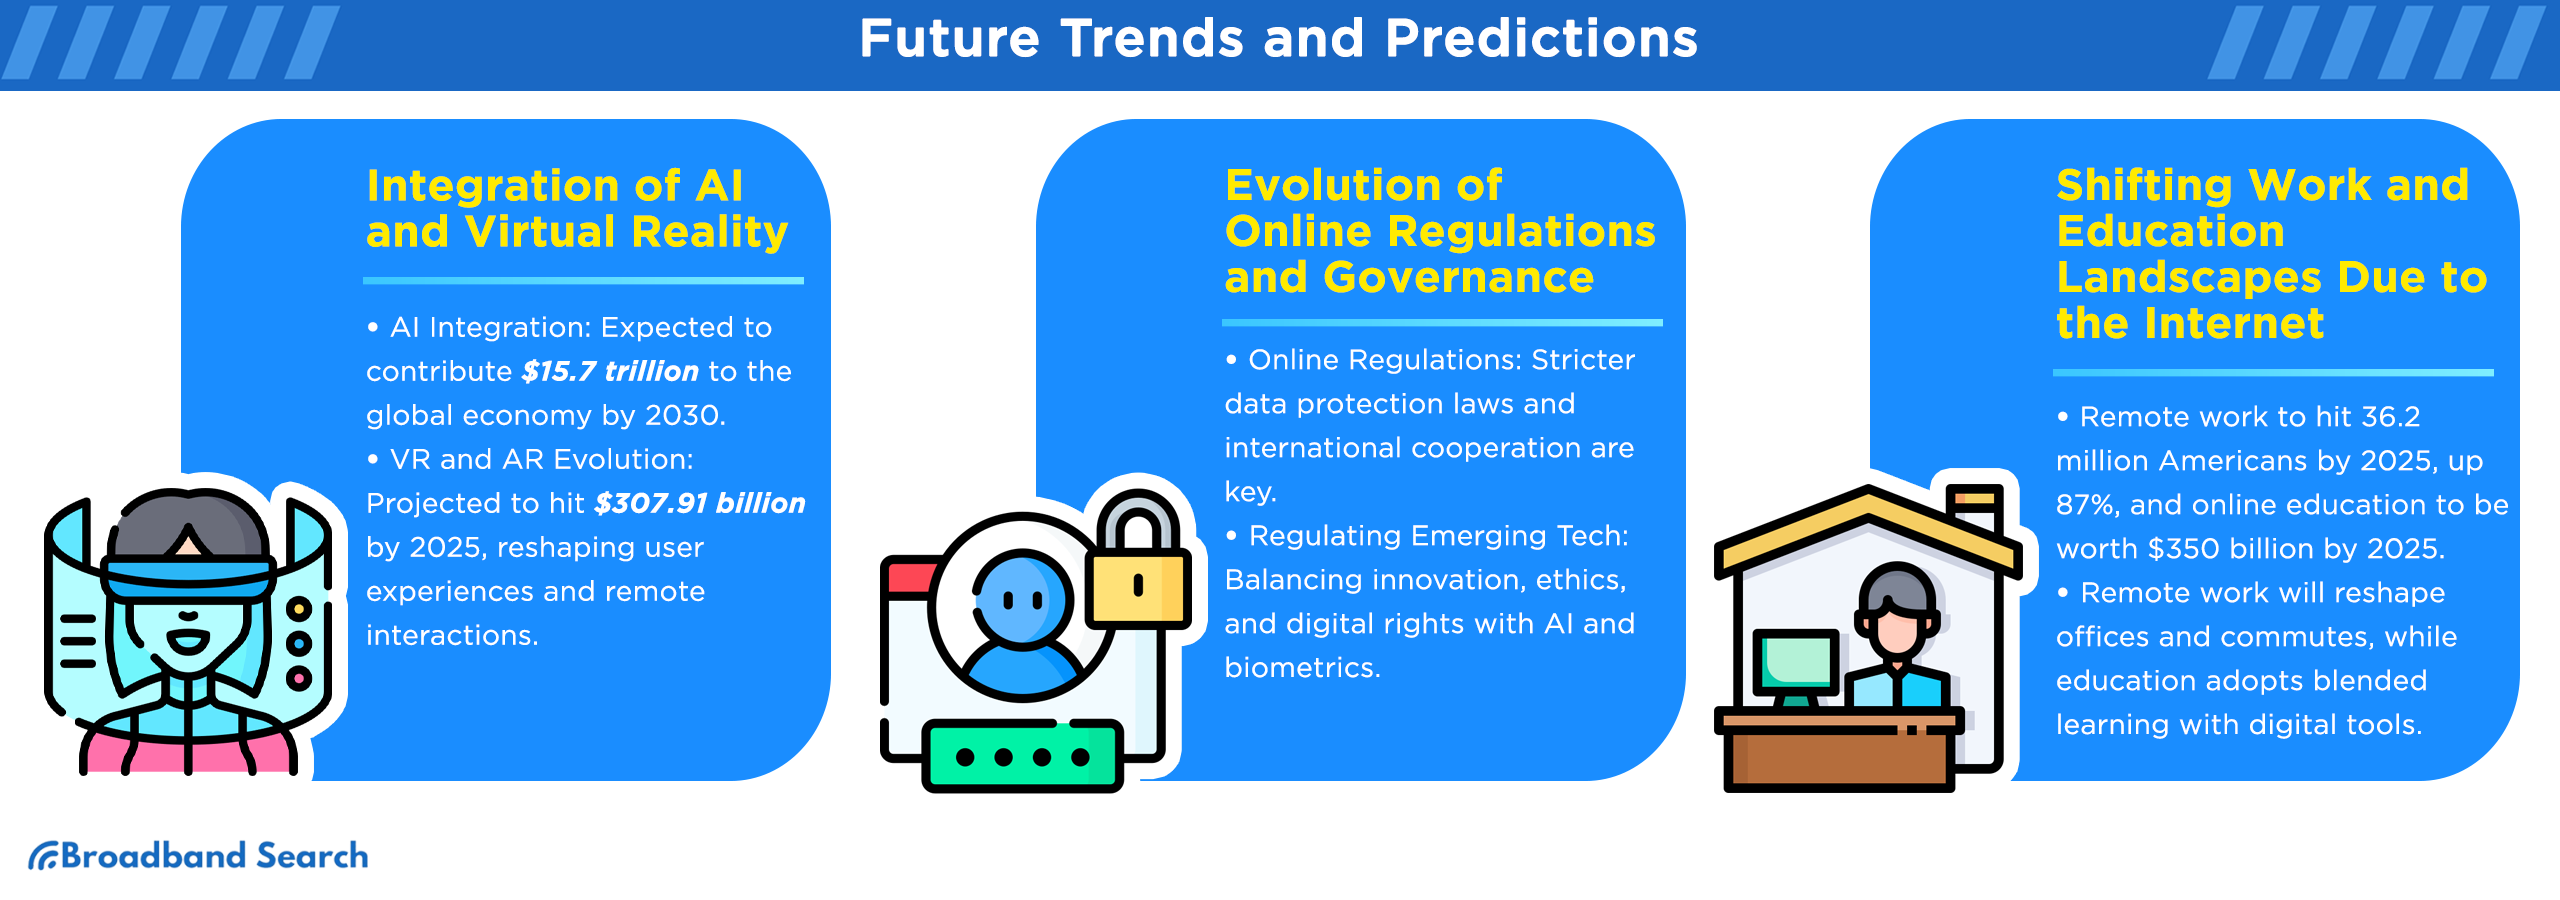
Economic forecasts suggest AI could contribute trillions in value over time, as in $15.7 trillion added to the global economy by 2030. Generative AI is changing how content is created and discovered, which is likely to keep reshaping search and social platforms.
Immersive Tech, AR/VR And the Metaverse
AR (augmented reality) and VR (virtual reality) are still early compared to phones and social media, but the hardware market is growing. IDC expects worldwide shipments of AR/VR headsets plus display-less smart glasses to grow in 2025, reaching 14.3 million units. Where will we see this growth in AR/VR hardware? Gaming, training, design, and more immersive remote collaboration are likely to expand AR/VR usage.
Regulation, Privacy and Digital Rights
More of life happens online, so more rules follow. Privacy laws, platform policies, and AI regulations are evolving in response to data collection, targeted advertising, and emerging risks. And the theme is consistent: as social, AI, and IoT expand, people and policymakers are asking for clearer consent, better transparency, and stronger security expectations.
What Today’s Internet Statistics Tell Us About Tomorrow
The big picture is surprisingly clear. The internet is close to universal in many regions, but billions of people still remain offline. Mobile, social, streaming, and IoT are staples of internet use, and 5G and AI will give us new experiences and new ways to use the internet.
As AI introduces a new landscape in internet experiences, we need to be mindful of the risks: privacy and security threats, misinformation, and the pressure to regulate powerful platforms and fast-moving AI tools.
FAQ
How many people use the internet in 2025?
About 6.0 billion people use the internet in 2025, or roughly 75% of the global population.
What percentage of internet traffic is mobile vs desktop?
Globally, recent data shows about 52% mobile, 47% desktop, and 1% tablet web traffic.
How many people use social media worldwide in 2025?
There are about 5.2 billion active social media user identities worldwide in 2025 (identities are not always the same as unique people).
How many people use smartphones to access the internet?
About 5.78 billion people use a mobile phone, and smartphones account for most handsets in use, which means smartphone-based internet access is the norm for billions of people. In the U.S., 9 in 10 adults own a smartphone.
How has remote work changed internet usage?
With remote work came the increased use of video calls, cloud apps, and collaboration tools. Since these tasks require faster upload speed and lower latency, remote workers began to demand better performance from internet providers, specifically better reliability and upload speed, not just download speed.

