
According to recent industry surveys from the American Customer Satisfaction Index (ACSI) and JD Power, customer satisfaction with Internet Service Providers (ISPs) depends on the type of internet connection. For example, fiber internet and 5G home internet lead in customer satisfaction scores, while older services like DSL lag.
Key Takeaways
- Fiber internet and 5G home internet earn the highest satisfaction scores for speed, reliability, and value.
- Cable internet sits in the middle; good speeds and availability but dragged down for price hikes and slower upload speeds.
- DSL internet ranks the lowest due to slow speeds, more frequent outages, and aging infrastructure.
- Fixed wireless and 5G home internet are the fastest-growing options, with new sign-ups outpacing traditional wired services.
- If you’re unhappy with your current service, checking for fiber or 5G home internet at your address is usually the best upgrade path.
What Matters Most to Internet Customers?
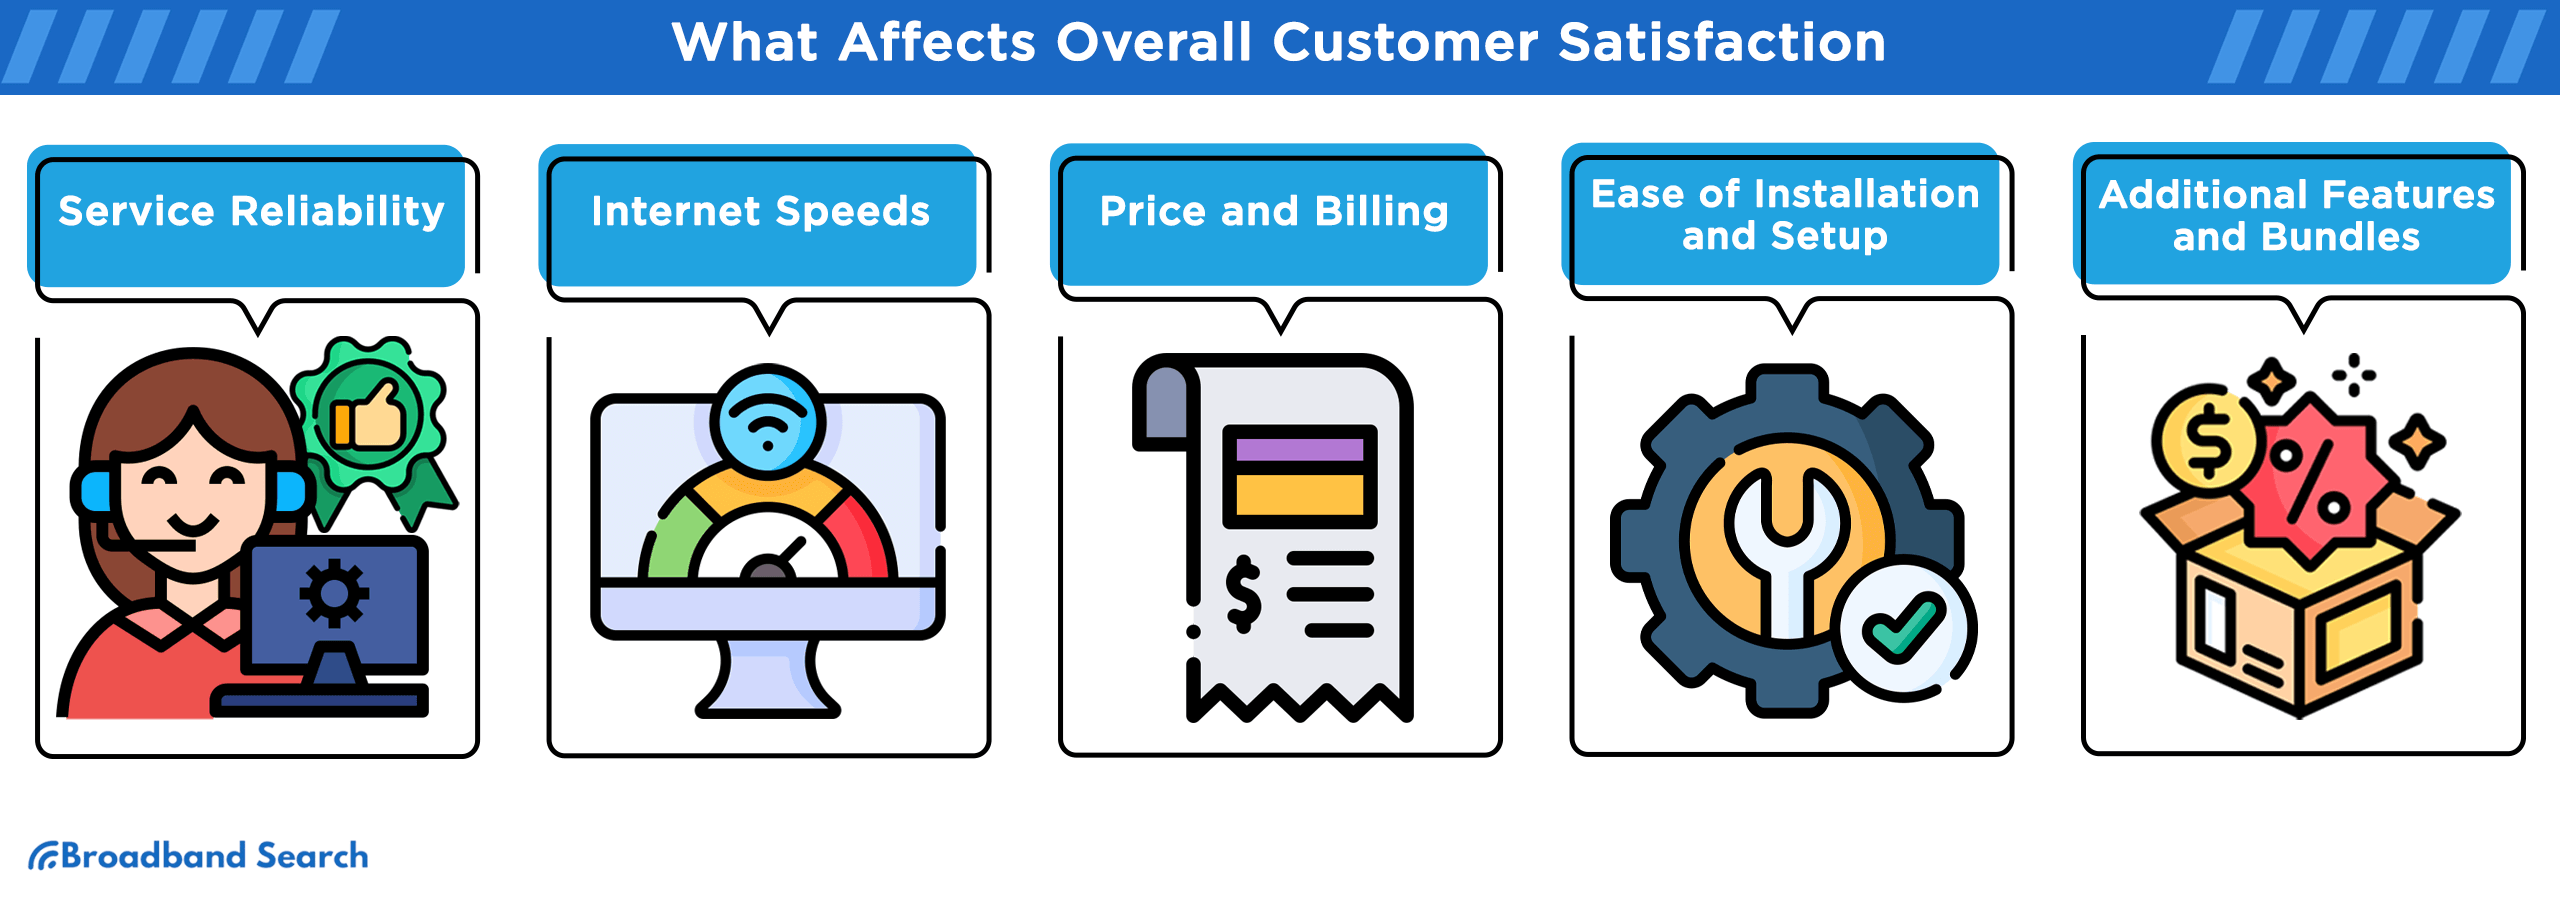
Price and reliability are consumers’ top satisfaction considerations. Here's a thorough breakdown of what customers care about in 2026 when they rate their internet service.
- Price and fees: Rate hikes and add-on fees are the #1 reason customers consider switching providers. 5G home internet markets itself on simple, flat pricing and multi-year price guarantees, which drives high satisfaction.
- Reliability and consistency: People care more about how well it works without interruptions than about advertised max Mbps numbers. Fiber and leading 5G home internet services get praised for day-to-day consistency.
- Actual Speeds: Upload speed for video calls, cloud backups, and online gaming, and peak-hour performance matter to most customers. Fiber is still best here; 5G home internet users increasingly say performance feels "as good as cable for normal home use."
- Customer support and setup: Long hold times and slow truck rolls still drag down cable and DSL satisfaction. Self-install 5G gateways and "plug it in, and you're online today" are big reasons people rate 5G home internet so highly.
- Billing Clarity & Trust: ISPs that advertise a locked rate and fewer surprises (no annual contract, equipment included) score higher on satisfaction. Verizon and T-Mobile both lean on multi-year and 5-year price guarantees for this reason.
Which Internet Connection Types Have the Happiest Customers?
Fiber internet generally has the happiest customers due to its superior speed and reliability. However, 5G home internet is a strong contender, often leading in satisfaction for value and setup.
Fiber internet
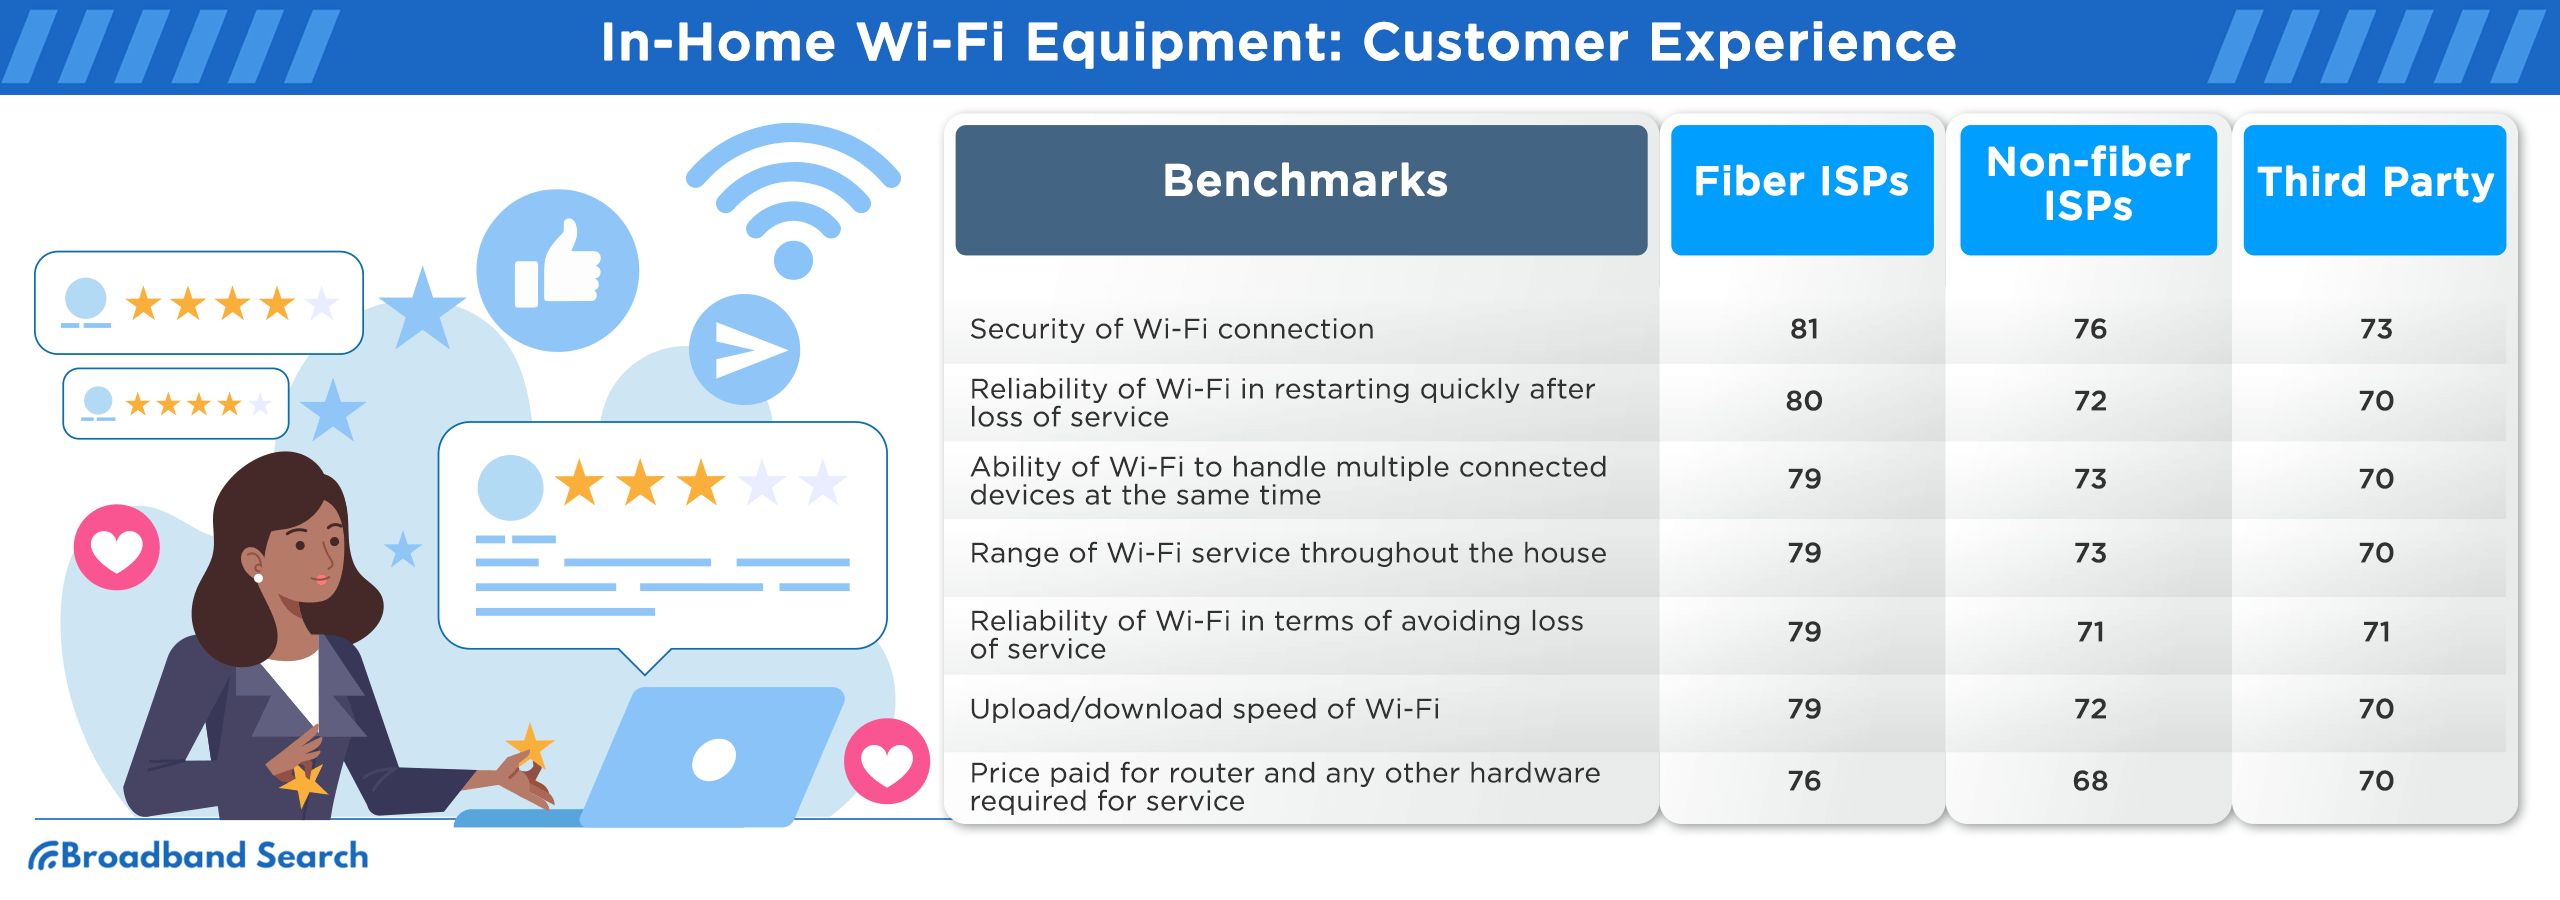
- Fiber has the highest satisfaction of all wired internet types in 2026 because it delivers high-speed downloads and uploads and is generally very reliable.
- Fiber still scored higher than non-fiber overall, though non-fiber (cable and 5G) narrowed the gap in 2025. Overall, ISP satisfaction = 72/100; fiber = 75; non-fiber = 70.
5G Home Internet (Fixed Wireless)
- 5G home internet is now one of the highest-rated connection types for overall satisfaction, value, and setup experience.
- Fixed wireless and 5G home internet sign-ups are growing roughly twice as fast as new wired sign-ups, showing how quickly people are switching.
Cable internet (coax)
- Cable sits in the middle: fast download speeds and wide availability keep people mostly satisfied.
- Top complaints: rising monthly costs over time and slower upload speeds than fiber, which hurts people who work from home, play games, or back up photos and videos.
DSL / Legacy Copper Infrastructure
- DSL is consistently rated the lowest: slow speeds, more dropouts, and struggles in multi-device homes. Many providers are actively phasing out DSL and moving customers to fiber builds or 5G home internet.
Satellite
- Legacy satellite internet(geostationary) tends to rate lower for high latency and inconsistency.
- Newer low-Earth-orbit (LEO) satellite options like Starlink tend to perform better than traditional satellites because of lower latency and higher speeds, but cost can still be a sticking point.
Comparing Customer Satisfaction by Internet Type
Internet Type | Overall Satisfaction | Why People Like It | Common Complaints / Limits |
Fiber internet | High | Very fast speeds (including uploads); stable and reliable. | Not available everywhere yet. Buildouts are still in progress in many areas. |
5G home internet / fixed wireless | High | Flat monthly price, no annual contract, self-install, "good enough" for streaming and work calls. | It can slow down in crowded areas or if the signal is weak. Performance can vary by location. |
Cable internet (coax) | Medium | Fast download speeds; widely available in suburbs and cities. | Price creep and fees; slower upload speeds than fiber (hurts WFH, gaming, backups). |
DSL / legacy copper | Low | Often the only wired option in older / rural areas. | Slow, unstable, struggles with multi-device homes; providers are phasing it out. |
Satellite internet | Low → Medium | Works where nothing else reaches; newer low-Earth-orbit (LEO) options can feel faster and more responsive than older satellites. | Legacy satellites have high latency, affected by weather, and often cost more; LEO is still pricey for some households. |
Which ISPs Get the Best Satisfaction Scores?
Fiber-optic internet providers consistently rank highest in customer satisfaction, with AT&T Fiber and Google Fiber frequently among the top performers in the American Customer Satisfaction Index (ACSI). Here’s detailed look at internet provider customer satisfaction by connection type:
Overall leaders (wired / fiber side)
Based on the American Customer Satisfaction Index (ACSI) Telecommunications Study 2024, here are the leaders in customer satisfaction by category:
- AT&T Fiber is the top-ranked fiber provider nationwide with an ACSI score of 80, a position it has held for multiple years. Customers generally praise it for overall reliability and network quality.
- Google Fiber and Verizon Fios are strong contenders, with both scoring around 76–77 in various reports due to high speed, consistency, and value.
- Smaller, regional fiber ISPs collectively perform very well, often tying with or closely following the national leaders in satisfaction ratings.
Wireless / 5G Leaders
- T-Mobile 5G Home Internet is the top-rated 5G provider, with an ACSI score of 76, putting it on par with many leading fiber services in some regions, thanks to its price satisfaction and easy installation.
- Verizon 5G Home Internet is a close second among 5G providers, scoring 74 in the ACSI study. It is known for its simple "plug it in, and you're online today" setup.
Cable standouts/movers
- Spectrum stands out as a major mover. The provider saw one of the most significant year-over-year increases in satisfaction, surging by 6% to an ACSI score of 68 in the 2024 report.
- Cox Communications has climbed 6% to an ACSI score of 68, matching Spectrum's performance.
- Xfinity (Comcast) is another key player that improved, rising 3% to a score of 67 because of its value and performance.
- Optimum has one of the most significant gains among all providers, rising from 9 points to 63. Despite this large jump, it remains near the bottom of the satisfaction ranking.
What Can You Do If You're Not Happy with Your Internet?
If you are unhappy with your internet service, you have several options, from troubleshooting existing issues to exploring new providers and technology types that may better suit your needs.
Here is a guide on the steps you can take to improve your internet situation:
1. Ask for a lower rate or promo
Call your provider and let them know you're considering switching. Ask if there's a loyalty discount, a retention promo, or a price guarantee tier (multi-year locked-rate plans are now common with 5G home internet and some fiber plans).
2. Upgrade your Wi-Fi gear
An old router is often a bottleneck. Replacing it with a Wi-Fi 6/6E router or mesh system can fix buffering and dead zones without changing providers.
3. Check if you're on the right speed tier
If you're streaming 4K on multiple TVs, doing video calls, gaming, and backing up photos to the cloud, a 25–50 Mbps plan won't cut it. You might need a higher tier from the same ISP, not a new ISP.
4. Track outages and slowdowns
Write down the times or screenshot speed tests when the service dies or slows to a crawl. You can use that record to request bill credits or a tech visit.
5. Ask about hardware swaps
If you're renting equipment from your ISP, ask if you're eligible for a new gateway or modem.
When Is It Time to Switch Providers?
It’s time to switch internet providers when you are unhappy with the service, your bill is rising without a corresponding improvement in speed, or better technology options like fiber or 5G home internet become available in your area.
Here are the key indicators that it's time to find a new internet service provider:
- Your monthly bill keeps going up, but your internet speed hasn't improved.
- You can now get fiber or 5G home internet in your area. Those options tend to rank higher in satisfaction for reliability and value than older DSL and many cable plans.
- You work from home, play online games, or upload a lot of files, and you need strong upload speeds. Fiber and some 5G plans are better for uploads than traditional cable or DSL.
- You're still on DSL with no room for improvement from the provider. Enter your ZIP code to compare internet options in your area. In many cases, switching to fiber or 5G home internet can get you more consistent speeds and better prices.
FAQ
What internet type has the highest customer satisfaction in 2026?
Fiber internet consistently has the highest customer satisfaction scores due to its superior speed, reliability, and symmetrical upload and download speeds.
Why are people leaving cable or DSL?
Customers often leave cable and DSL for two main reasons: rising costs and hidden fees and the availability of better technologies. Cable and DSL providers frequently face criticism for increasing prices after promotional periods and for poor customer service. Newer fiber and 5G home internet options offer more transparent pricing and improved performance.
Which is the best type of internet connection?
Fiber-optic internet is widely considered the best type of connection for most users because it offers the fastest, most stable, and lowest-latency service available. However, the "best" type for you depends on availability and your budget; use the FCC Broadband Map to see what's offered at your address.
Is 5G home internet fast enough for streaming and work calls?
Yes, 5G home internet is generally fast enough for streaming video in high definition and handling work video calls. Many users report that 5G performance feels "as good as cable for normal home use," though performance can vary based on network congestion and signal strength in your specific location.